The following data provides a snapshot of historical enrollment/class sizes and current class sizes. An average means some individual classes may be smaller or larger, but most are a good indicator of size. The information includes elementary, middle school, and high school sizes and class averages. In addition, the district’s long-term enrollment trend data is included. The goal of the district has been to maintain programs, increase student services, and keep class sizes manageable during a time of significant state aid loss due to decreased enrollment.
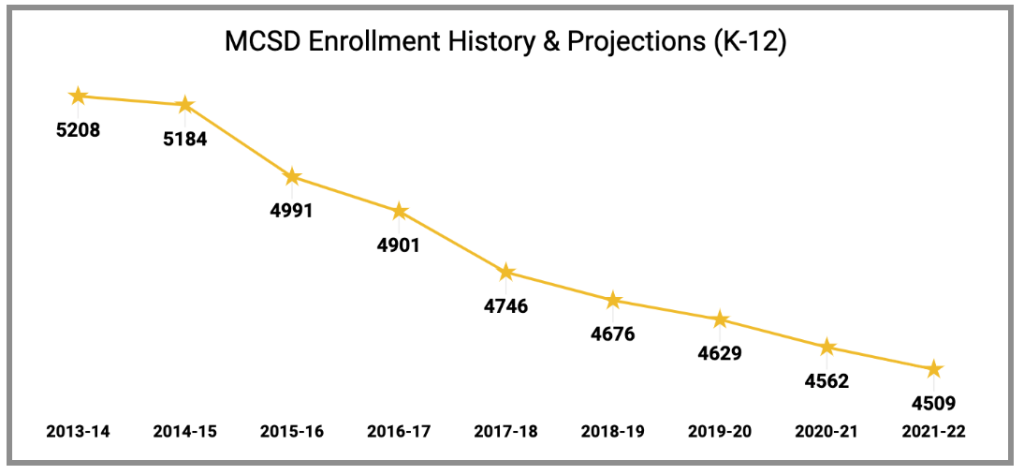
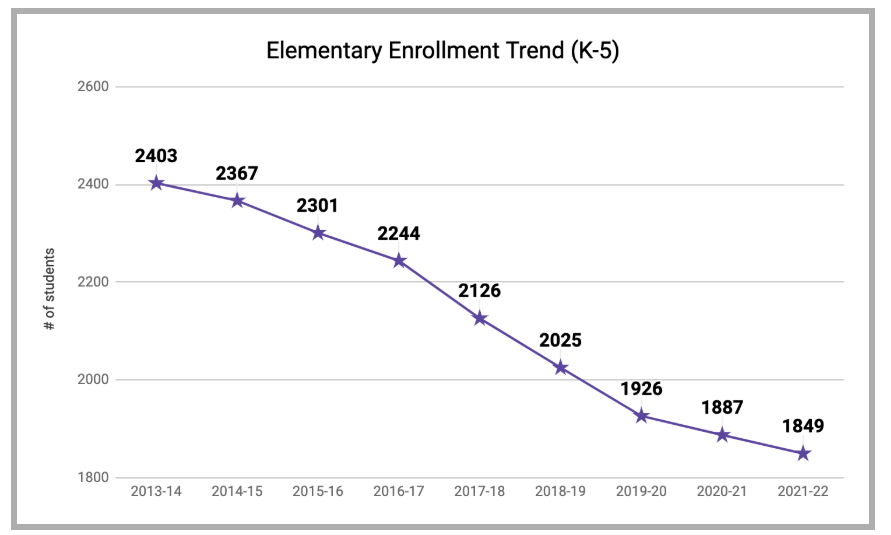
Enrollment History and Projects & Trends
Class Size
Elementary Enrollment Data – 2019-20
Even with closing two K-5 locations, Muscatine School’s average class size at each grade level remains consistent. The district’s K-5 overall class size was 21.7 in 2014-2015 and in 2019-20 it is 21.6.
Comparison of the Class Sizes from 2014-15 and 2019-20
Our average class size at each grade level remains consistent. Our district K-5 overall class size was 21.7 in 2014-15 and in the current school year it is 21.6.
Average Class Size by Grade
Year
K-5
Kdg
1st
2nd
3rd
4th
5th
2014-15
21.7
20.2
21.7
21.4
22.0
22.7
22.4
2019-20
21.6
22.1
21.0
19.7
20.5
23.3
22.8
6 Year Average
20.6
18.9
19.9
20.3
21.0
22.0
21.6
Two-Year K-6 Building Enrollment Comparison
2017-2018 Comparison
Building
K-5 Enrollment
6th Grade Enrollment
Colorado
251
–
Franklin
266
–
Grant
280
–
Jefferson
415
–
Madison
225
–
McKinley
424
–
Mulberry
246
–
2019-2020 Comparison
Building
K-5 Enrollment
6th Grade Enrollment
Franklin
269
50
Grant
302
59
Jefferson
421
72
Madison
389
75
McKinley
396
81
Mulberry
252
45
Average by Elementary School Building
School
Average Number of Students
Franklin
21.3
Grant
22.6
Jefferson
21.4
Madison
22.0
McKinley
22.7
Mulberry
19.8
K-6 District Average
21.7
Average Class Size by Elementary Grade Level
Grade
Average Number of Students
Kindergarten
22.1
1st
21.0
2nd
19.7
3rd
20.5
4th
23.3
5th
22.8
6th
22.5
K-6 District Average
21.7
2019-20 Average Class Size by Elementary School Grade and Building
School
K-6 Avg. Class Size
Kdg
1st
2nd
3rd
4th
5th
6th
Franklin
21.3
21.0
19.0
20.0
18.5
20.0
25.5
25.0
Grant
22.6
19.3
28.0
21.5
23.0
25.5
24.0
19.7
Jefferson
21.4
23.0
23.3
21.0
25.7
24.0
17.5
18.0
Madison
22.0
23.3
20.3
20.3
19.3
24.0
22.0
25.0
McKinley
22.7
23.7
22.0
18.7
18.7
24.0
25.0
27.0
Mulberry
19.8
22.5
15.0
16.0
16.5
21.0
27.5
22.5
K-6 District
21.7
22.1
21.0
19.7
20.5
23.3
22.8
22.5
2019-20 Total Number of Students, Average Class Size, and Number of Sections per Grade Level
K-6 Total
School
Number of Students
Average Class Size
Number of Sections
Franklin
319
21.3
15
Grant
361
22.6
16
Jefferson
493
21.4
23
Madison
463
22.0
21
McKinley
477
22.7
21
Mulberry
297
19.8
15
District
2,410
21.7
111
Kindergarten
School
Number of Students
Average Class Size
Number of Sections
Franklin
63
21.0
3
Grant
58
19.3
3
Jefferson
69
23.0
3
Madison
70
23.3
3
McKinley
71
23.7
3
Mulberry
45
22.5
2
District
376
22.1
17
Grade 1
School
Number of Students
Average Class Size
Number of Sections
Franklin
38
19.0
2
Grant
56
28.0
2
Jefferson
70
23.3
3
Madison
61
20.3
3
McKinley
66
22.0
3
Mulberry
45
15.0
2
District
336
21.0
16
Grade 2
School
Number of Students
Average Class Size
Number of Sections
Franklin
40
20.0
2
Grant
43
21.5
2
Jefferson
63
21.0
3
Madison
61
20.3
3
McKinley
56
18.7
3
Mulberry
32
16.0
2
District
295
19.7
15
Grade 3
School
Number of Students
Average Class Size
Number of Sections
Franklin
37
18.5
2
Grant
46
23.0
2
Jefferson
77
25.7
3
Madison
58
19.3
3
McKinley
56
18.7
3
Mulberry
33
16.5
2
District
307
20.5
15
Grade 4
School
Number of Students
Average Class Size
Number of Sections
Franklin
40
20.0
2
Grant
51
25.5
2
Jefferson
72
24.0
3
Madison
72
24.0
3
McKinley
72
24.0
3
Mulberry
42
21.0
2
District
349
23.3
15
Grade 5
School
Number of Students
Average Class Size
Number of Sections
Franklin
51
25.5
2
Grant
48
24.0
2
Jefferson
70
17.5
4
Madison
66
22.0
3
McKinley
75
25.0
3
Mulberry
55
27.5
2
District
365
22.8
16
Grade 6
School
Number of Students
Average Class Size
Number of Sections
Franklin
50
25.0
2
Grant
59
19.7
3
Jefferson
72
18.0
4
Madison
75
25.0
3
McKinley
81
27.0
3
Mulberry
45
22.5
2
District
382
22.5
17
Number of Students Per Section – Elementary 6th Grade
School
Section
Number of Students
Number of Teachers
Franklin
1
26
1
2
24
1
Grant
1
28
2
2
31
1
Jefferson
1
19
1
2
18
1
3
18
1
4
17
1
Madison
1
25
1
2
25
1
3
25
1
McKinley
1
27
1
2
27
1
3
27
1
Mulberry
1
24
1
2
21
1
Total Sections
16
Average Students per Teacher
22.5
Preschool Enrollment Data – 2019-20
The following chart includes all students in either grade levels PK3 or PK4. The number of students shows an overall count of students.
Number of Students
2018-19
2019-20
PK3
45
51
PK4
115
169
Total number of students
160
220
Middle School Enrollment Data – 2019-20
The chart below shows the average number of students, per department currently at each of our middle schools.
English/Language Arts
School
Average number of students
Central
19.2
West
20.5
Average
19.8
Exploratory
School
Average number of students
Central
21.2
West
19.8
Average
20.6
Fine Arts
School
Average number of students
Central
22.9
West
26.4
Average
24.4
Math
School
Average number of students
Central
17.5
West
20.1
Average
18.7
Science
School
Average number of students
Central
20.4
West
20.5
Average
20.5
Social Studies
School
Average number of students
Central
22.5
West
21.2
Average
21.6
All Departments
Average number of students
All departments
20.6
Middle School Enrollment
School
Number of Students
Central Middle School
391
West Middle School
368
Total for 2019-20
759
Projected Middle School Enrollment for 2020-21
752
High School Enrollment Data – 2019-20
The following chart states the average number of students by the course. Physical Education credit courses are not listed in this table but have an average class size of 35.55.
Course
Average number of students
Elective
15.84
English 10
19.47
English 11
23.00
English 12
21.08
English 9
19.88
Math
20.46
Science – Chemistry
19.22
Science – Elective
16.00
Science – Biology
17.81
Science – Physics
21.47
Social Studies – Economics
20.88
Social Studies – Elective
19.00
Social Studies – U.S. Government
21.25
Social Studies – U.S. History
17.84
MHS Total
17.80
The chart below shows the average number of students, per section, by department at the High School.
Department
Average number of students
Business/Family
18.82
English/Language Arts
20.03
Fine Arts
21.16
Industrial Tech
16.58
Math
20.46
Science
18.84
Social Studies
19.03
World Languages
19.16
MHS Total
19.27
Open Enrollment 2019-20
Open Enrollment Out Comparative Data with Like-Sized Districts